Contact
Département d'informatique
Université du Québec à Montréal
CP 8888, Succ. Centre-ville
Montréal (Québec) H3C 3P8
Phone: 514-987-3000, #5516
Office: PK-4525
Email: blondin_masse[dot]alexandre
[at]uqam[dot]ca
About
I have completed my Ph.D. in mathematics and computer science under the supervision of Professors Srecko Brlek, from Université du Québec à Montréal, in Canada, and Laurent Vuillon, from Université de Savoie, in France.Since August 1st, 2014, I'm a regular assistant-professor at Université du Québec à Montréal, in Canada.
Links
- My profile on Google Scholar
- My GitLab repositories
- My Bitbucket repositories
- My Github repositories
Recursivity and fractals
[français]On 02/29/2012 by Alexandre Blondin Massé
An interesting way to teach recursive algorithms is to show that it is possible to generate nice pictures by simple recursive algorithms.
For this purpose, the turtle Python-module is particularly well-adapted.
When I was eight years old, I remember discovering the power of programing with
LogoWriter, a very
simple language that allows to draw pictures and initiate people to the basics
of programing: loops, control structures, etc.
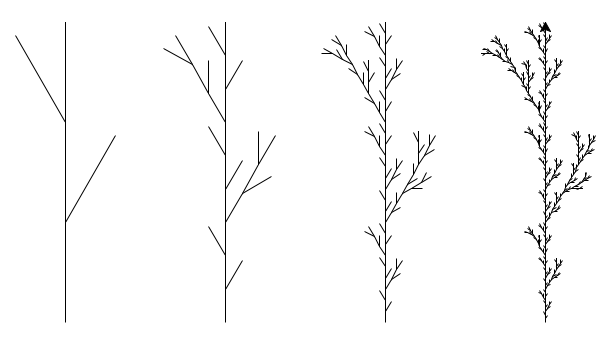
The following code allows one to draw a classical 2D plant-like graphic.
from turtle import *

def reset(x, y):
    r"""
    Moves the turtle to position (x, y) without
    drawing anything and sets the angle to 90.
    """
    penup()
    setpos(x, y)
    pendown()
    setheading(90)

def f(height, resolution):
    r"""
    Draws a plant of given height and given
    resolution.

    The highest the resolution is, the more
    detailed the plant is drawn. For instance,
    if the resolution is 1, then the basic
    plant is drawn. If the resolution is 3,
    then the plant presents many details.
    """
    if resolution == 0:
        forward(height)
    else:
        # Drawing the bottom
        f(height / 3.0, resolution - 1)

        # Drawing the right branch
        right(30)
        f(height / 3.0, resolution - 1)
        penup()
        backward(height / 3.0)
        pendown()

        # Drawing the middle
        left(30)
        f(height / 3.0, resolution - 1)

        # Drawing the left branch
        left(30)
        f(height / 3.0, resolution - 1)
        penup()
        backward(height / 3.0)
        pendown()

        # Drawing the top part
        right(30)
        f(height / 3.0, resolution - 1)

# Drawing parameters
height = 300                                    # height of plants
ss     = ['slowest', 'slow', 'fast', 'fastest'] # speeds
xs     = [-240, -80, 80, 240]                   # x positions of plants
y      = -100                                   # y position of plants

# Draw plants
for i in range(4):
    speed(ss[i])
    reset(xs[i], y)
    f(height, i + 1)

exitonclick()
Below is the final picture obtained:
Further details might be found there.